Seismic lines 2014-2015
Description
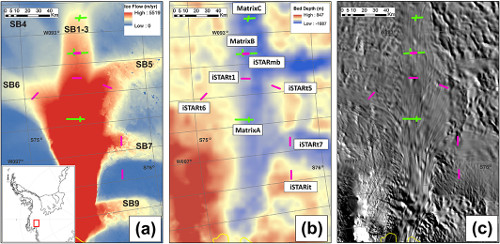
Seismic line tracks deployed during the collection of seismic reflection profilers during the 2014/2015 field season traverse.
Seismics reflection profiles help to derive basal properties of the ice and distinguish deforming sediment or basal sliding. By measuring the amplitude of the basal return along the line it is possible to identify basal ice properties.
The seismic source used for the reflection profiles was 300 g of high explosive, placed in holes of 20 m depth, backfilled with snow. A shot interval of 240 m and receiver interval of 10 m with 30 m offset was used throughout to produce single-fold normal-incidence (10 percent incidence angle) data with a midpoint interval of 5 m .
Seismic reflection profiles 7.2 km in length were acquired at each site, with the specific selection of profiles at each site designed overall to sample a range of bed features characteristic of the entire basin.
References
1. Brisbourne, A. M., A. M. Smith, D. G. Vaughan, E. C. King, D. Davies, R. G. Bingham, E. C. Smith, I. Nias, and S. H. R. Rosier (2017), Bed conditions of Pine Island Glacier, West Antarctica, Journal of Geophysical Research: Earth Surface, 122(1), 419-433, doi:10.1002/2016JF004033. Available here
2. iSTAR - Summary of activities
3. iSTAR-C: Preperation update
Field photo

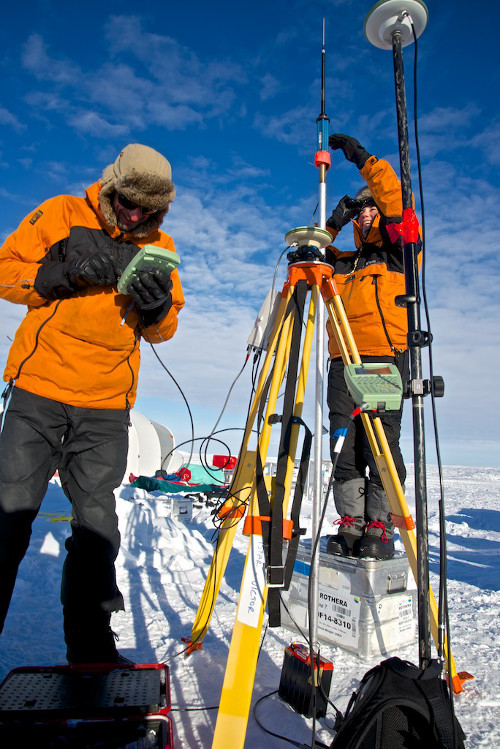
iSTAR team preparing the GPS system and seismic equipment for operating seismics data collection. Alex Taylor, BAS
Figures

Figure 1: Location of seismic profiles across Pine Island Glacier used in this study. The inset in Figure 1a shows the location of the detailed maps of PIG within West Antarctica (red box). (a) Ice-flow speed in m yr−1 from interferometric synthetic aperture radar (InSAR) measurements [Rignot et al., 2011b]. The “SBx” annotation refers to the tributary nomenclature of Stenoien and Bentley [2000]. (b) Bedmap2 bed elevation [Fretwell et al., 2013]. iSTAR seismic lines (acquired 2014/2015) are in magenta, and Matrix lines (acquired 2006–2008) are in green. (c) Moderate Resolution Imaging Spectroradiometer (MODIS) image [Scambos et al., 2007]. Brisbourne et al., 2017